End to end monitoring
Learn end-to-end monitoring with puppeteer and playwright to test key website flows. Follow our guide that gets you up and running in 10 minutes.
Headless browser testing
Over the course of the last decade, especially thanks to tools such as Selenium and (more recently) Cypress, automated End-to-End testing (E2E testing) has become widespread across industries.
Broadly speaking, E2E testing entails running fully automated test suites with the goal of catching bugs before they hit production and, therefore, negatively affect the user experience. These test suites need to be carefully scripted using dedicated tools, as well as to be made stable and fast enough to test the most important end-user flows on every build, PR or commit, depending on the application under test and the organisation’s automation maturity.
The industry has learned to struggle with the challenges this approach presents:
- Long-running suites.
- Test flakiness.
- Expensive test infrastructure.
All of the above lead to higher costs and slower delivery.
The appearance of mature headless browser automation tools, such as Puppeteer and Playwright, offers a response to many of the above issues by allowing testing in the browser without its GUI, which yields higher speed and stability coupled with lower resource consumption.
E2E monitoring (AKA synthetic monitoring)
While this nimbler, more reliable kind of test is already a big improvement for pre-production testing, it enables a completely new approach in production monitoring: we can now continuously run E2E tests against our production systems. This enables us to have real-time feedback on the status of our website’s key user flows from a user’s perspective. This is E2E monitoring, also known as synthetic monitoring or active monitoring.
This comes with a significant, often underestimated advantage: it allows us to catch all those things that might break in production that can’t be caught during pre-production testing. We are now running directly against the system that the end-user is actually interacting with, and will be able to monitor its behaviour in real time.
What could this look like in practice? Let’s look at an e-commerce example.
Monitoring a web shop
A few key flows for an e-commerce websites could be:
- Logging in
- Finding a product through search
- Adding products to the basket and checking out
Let’s see how to set them up - for this example, we will do that on our demo web shop.

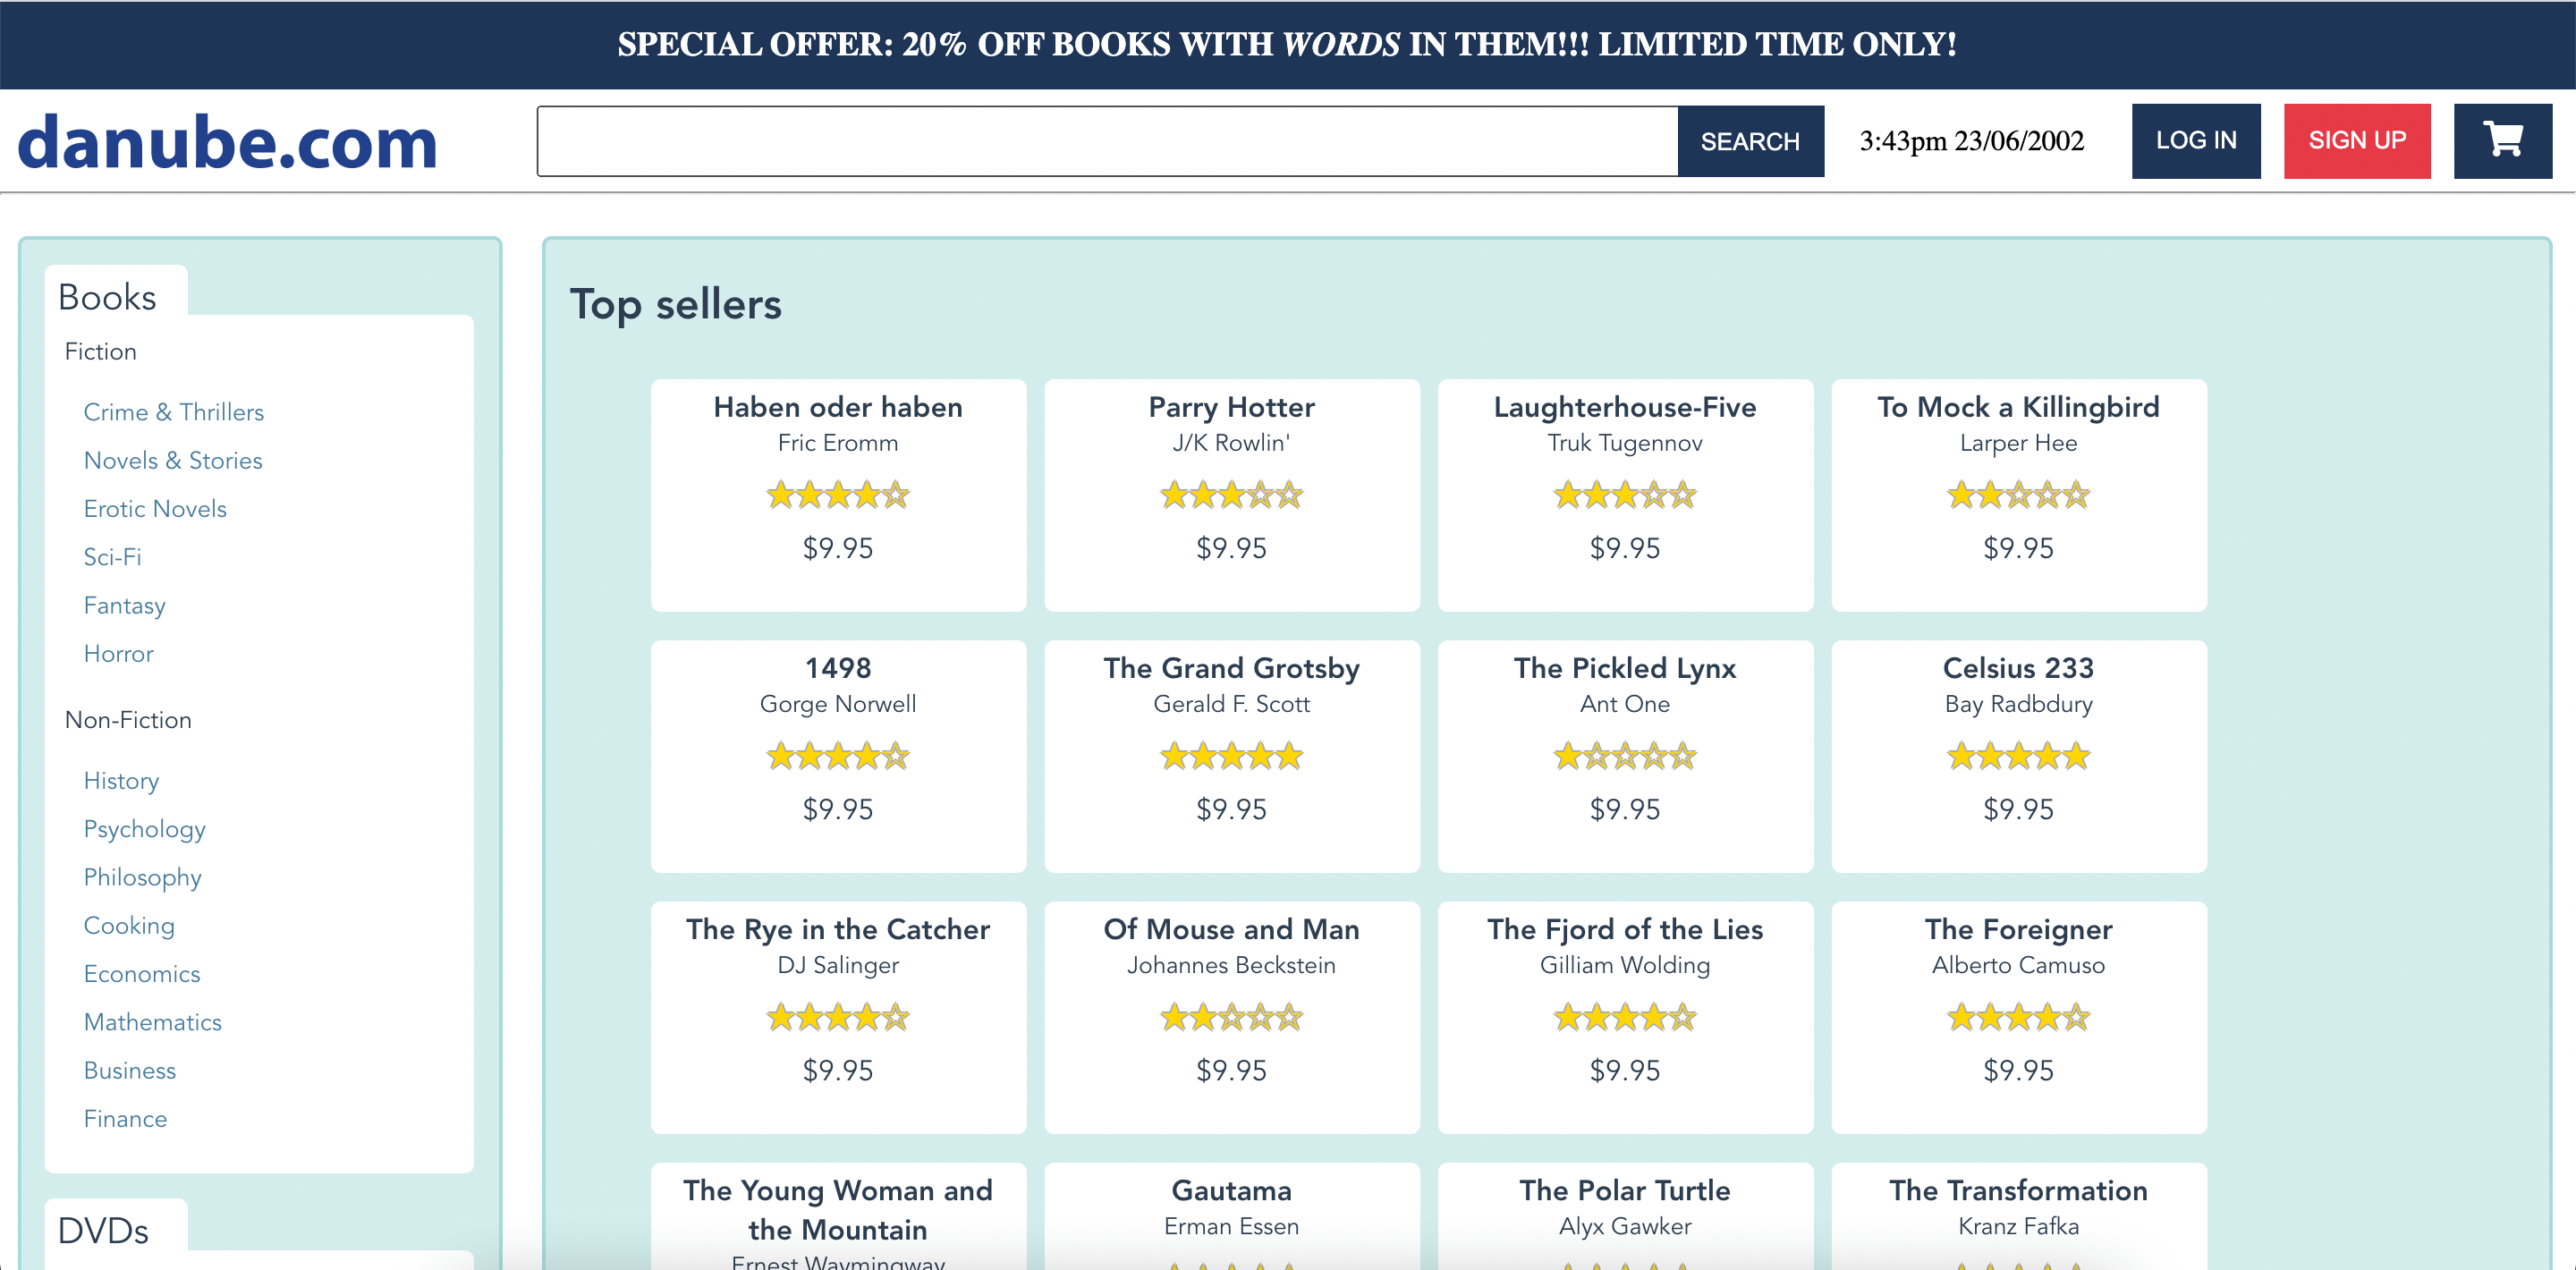
Our demo website
Playwright E2E tests
Using Playwright, we can script our three E2E scenarios as follows:
const { chromium } = require("playwright");

(async () => {

  // launch the browser and open a new page
  const browser = await chromium.launch();
  const page = await browser.newPage();

  // navigate to our target web page
  await page.goto("https://danube-web.shop/");

  // click on the login button and go through the login procedure
  await page.click("#login");
  await page.type("#n-email", "user@email.com");
  await page.type("#n-password2", "supersecure1");
  await page.click("#goto-signin-btn");

  // wait until the login confirmation message is shown
  await page.waitForSelector("#login-message", { visible: true });

  // close the browser and terminate the session
  await browser.close();
})();
const { chromium } = require("playwright");
const assert = require("chai").assert;

(async () => {

 // launch the browser and open a new page
 const browser = await chromium.launch();
 const page = await browser.newPage();

 const bookList = [
   "The Foreigner",
   "The Transformation",
   "For Whom the Ball Tells",
   "Baiting for Robot",
 ];

 // navigate to our target web page
 await page.goto("https://danube-web.shop/");

 // search for keyword
 await page.click(".topbar > input");
 await page.type(".topbar > input", "for");
 await page.click("#button-search");
 await page.waitForSelector(
   ".shop-content > ul > .preview:nth-child(1) > .preview-title"
 );

 // halt immediately if results do not equal expected number
 let resultsNumber = (await page.$$(".preview-title")).length;
 assert.equal(resultsNumber, bookList.length);

 // remove every element found from the original array...
 for (i = 0; i < resultsNumber; i++) {
   const resultTitle = await page.$eval(
     `.preview:nth-child(${i + 1}) > .preview-title`,
     (e) => e.innerText
   );

   const index = bookList.indexOf(resultTitle);
   bookList.splice(index, 1);
 }

 // ...then assert that the original array is now empty
 assert.equal(bookList.length, 0);

 // close the browser and terminate the session
 await browser.close();
})();
const { chromium } = require("playwright");

(async () => {

  // launch the browser and open a new page
  const browser = await chromium.launch();
  const page = await browser.newPage();

  const navigationPromise = page.waitForNavigation();

  // navigate to our target web page
  await page.goto("https://danube-web.shop/");

  // add the first item to the cart
  await page.click(`.preview:nth-child(1) > .preview-author`);
  await page.click(".detail-wrapper > .call-to-action");
  await page.click("#logo");

  // wait until navigation is complete
  await navigationPromise;

  // navigate to cart and proceed
  await page.click("#cart");
  await page.click(".cart > .call-to-action");
  await page.click("#s-name");

  // fill out checkout info
  await page.type("#s-name", "Max");
  await page.type("#s-surname", "Mustermann");
  await page.type("#s-address", "Charlottenstr. 57");
  await page.type("#s-zipcode", "10117");
  await page.type("#s-city", "Berlin");
  await page.type("#s-company", "Firma GmbH");
  await page.click(".checkout > form");
  await page.click("#asap");

  // confirm checkout
  await page.click(".checkout > .call-to-action");

  // wait until the order confirmation message is shown
  await page.waitForSelector("#order-confirmation", { visible: true });

  // close the browser and terminate the session
  await browser.close();
})();
These can be run on our own machine without issues with very little preparation with a simple node script.js.
Monitoring application performance
A web application’s performance plays a primary role in the user experience it delivers. From the user’s perspective, a fully functional application that is not performant quickly becomes indistinguishable from a broken one.
Using Playwright together with browser APIs or additional performance libraries, our end-to-end monitoring setup can be easily extended to include application performance.
Measuring execution time
An effective and granular way to gauge performance is to measure how long our scenario takes to execute. A very simple way to achieve this is to just time our script’s execution with time node script.js.
Oftentimes it pays to be more granular. For example, we might want to measure the durations of certain segments of a given flow and assert against them. We can do all this in our script. For example, in the case of our longer checkout example:
const { chromium } = require("playwright");
// we add an assertion library
const assert = require("chai").assert;

(async () => {

  // launch the browser and open a new page
  const browser = await chromium.launch();
  const page = await browser.newPage();

  const navigationPromise = page.waitForNavigation();

  // get first timestamp
  const tFirstNavigationStarts = Date.now()

  // navigate to our target web page
  await page.goto("https://danube-web.shop/");

  // get second timestamp
  const tFirstNavigationEnds = Date.now()

  // add the first item to the cart
  await page.click('.preview:nth-child(1) > .preview-author');
  await page.click(".detail-wrapper > .call-to-action");
  await page.click("#logo");

  // ...

  // wait until the order confirmation message is shown
  await page.waitForSelector("#order-confirmation", { visible: true });

  // get thirds timestamp
  const tScenarioEnds = Date.now();

  // calculate timings
  const dNavigation = tFirstNavigationEnds - tFirstNavigationStarts;
  const dScenario = tScenarioEnds - tFirstNavigationStarts ;

  // assert against the timings we have measured
  assert.isBelow(dNavigation, 1750, 'Initial navigation took longer than 1.75s')
  assert.isBelow(dScenario, 3000, 'Total scenario took longer than 3s')

  // close the browser and terminate the session
  await browser.close();
})();
We can also use Web Performance APIs such as Navigation Timing and Resource Timing, as well as libraries such as Google Lighthouse. For more examples, see our dedicated performance guide.
End to end application monitoring
Unlike headful tools, headless ones tend to not be very resource-hungry, which makes it easier to move our scripts to the cloud. Checkly runs on top of AWS Lambda, and enables us to quickly copy-paste our script and set it up to run on a schedule from locations around the world.

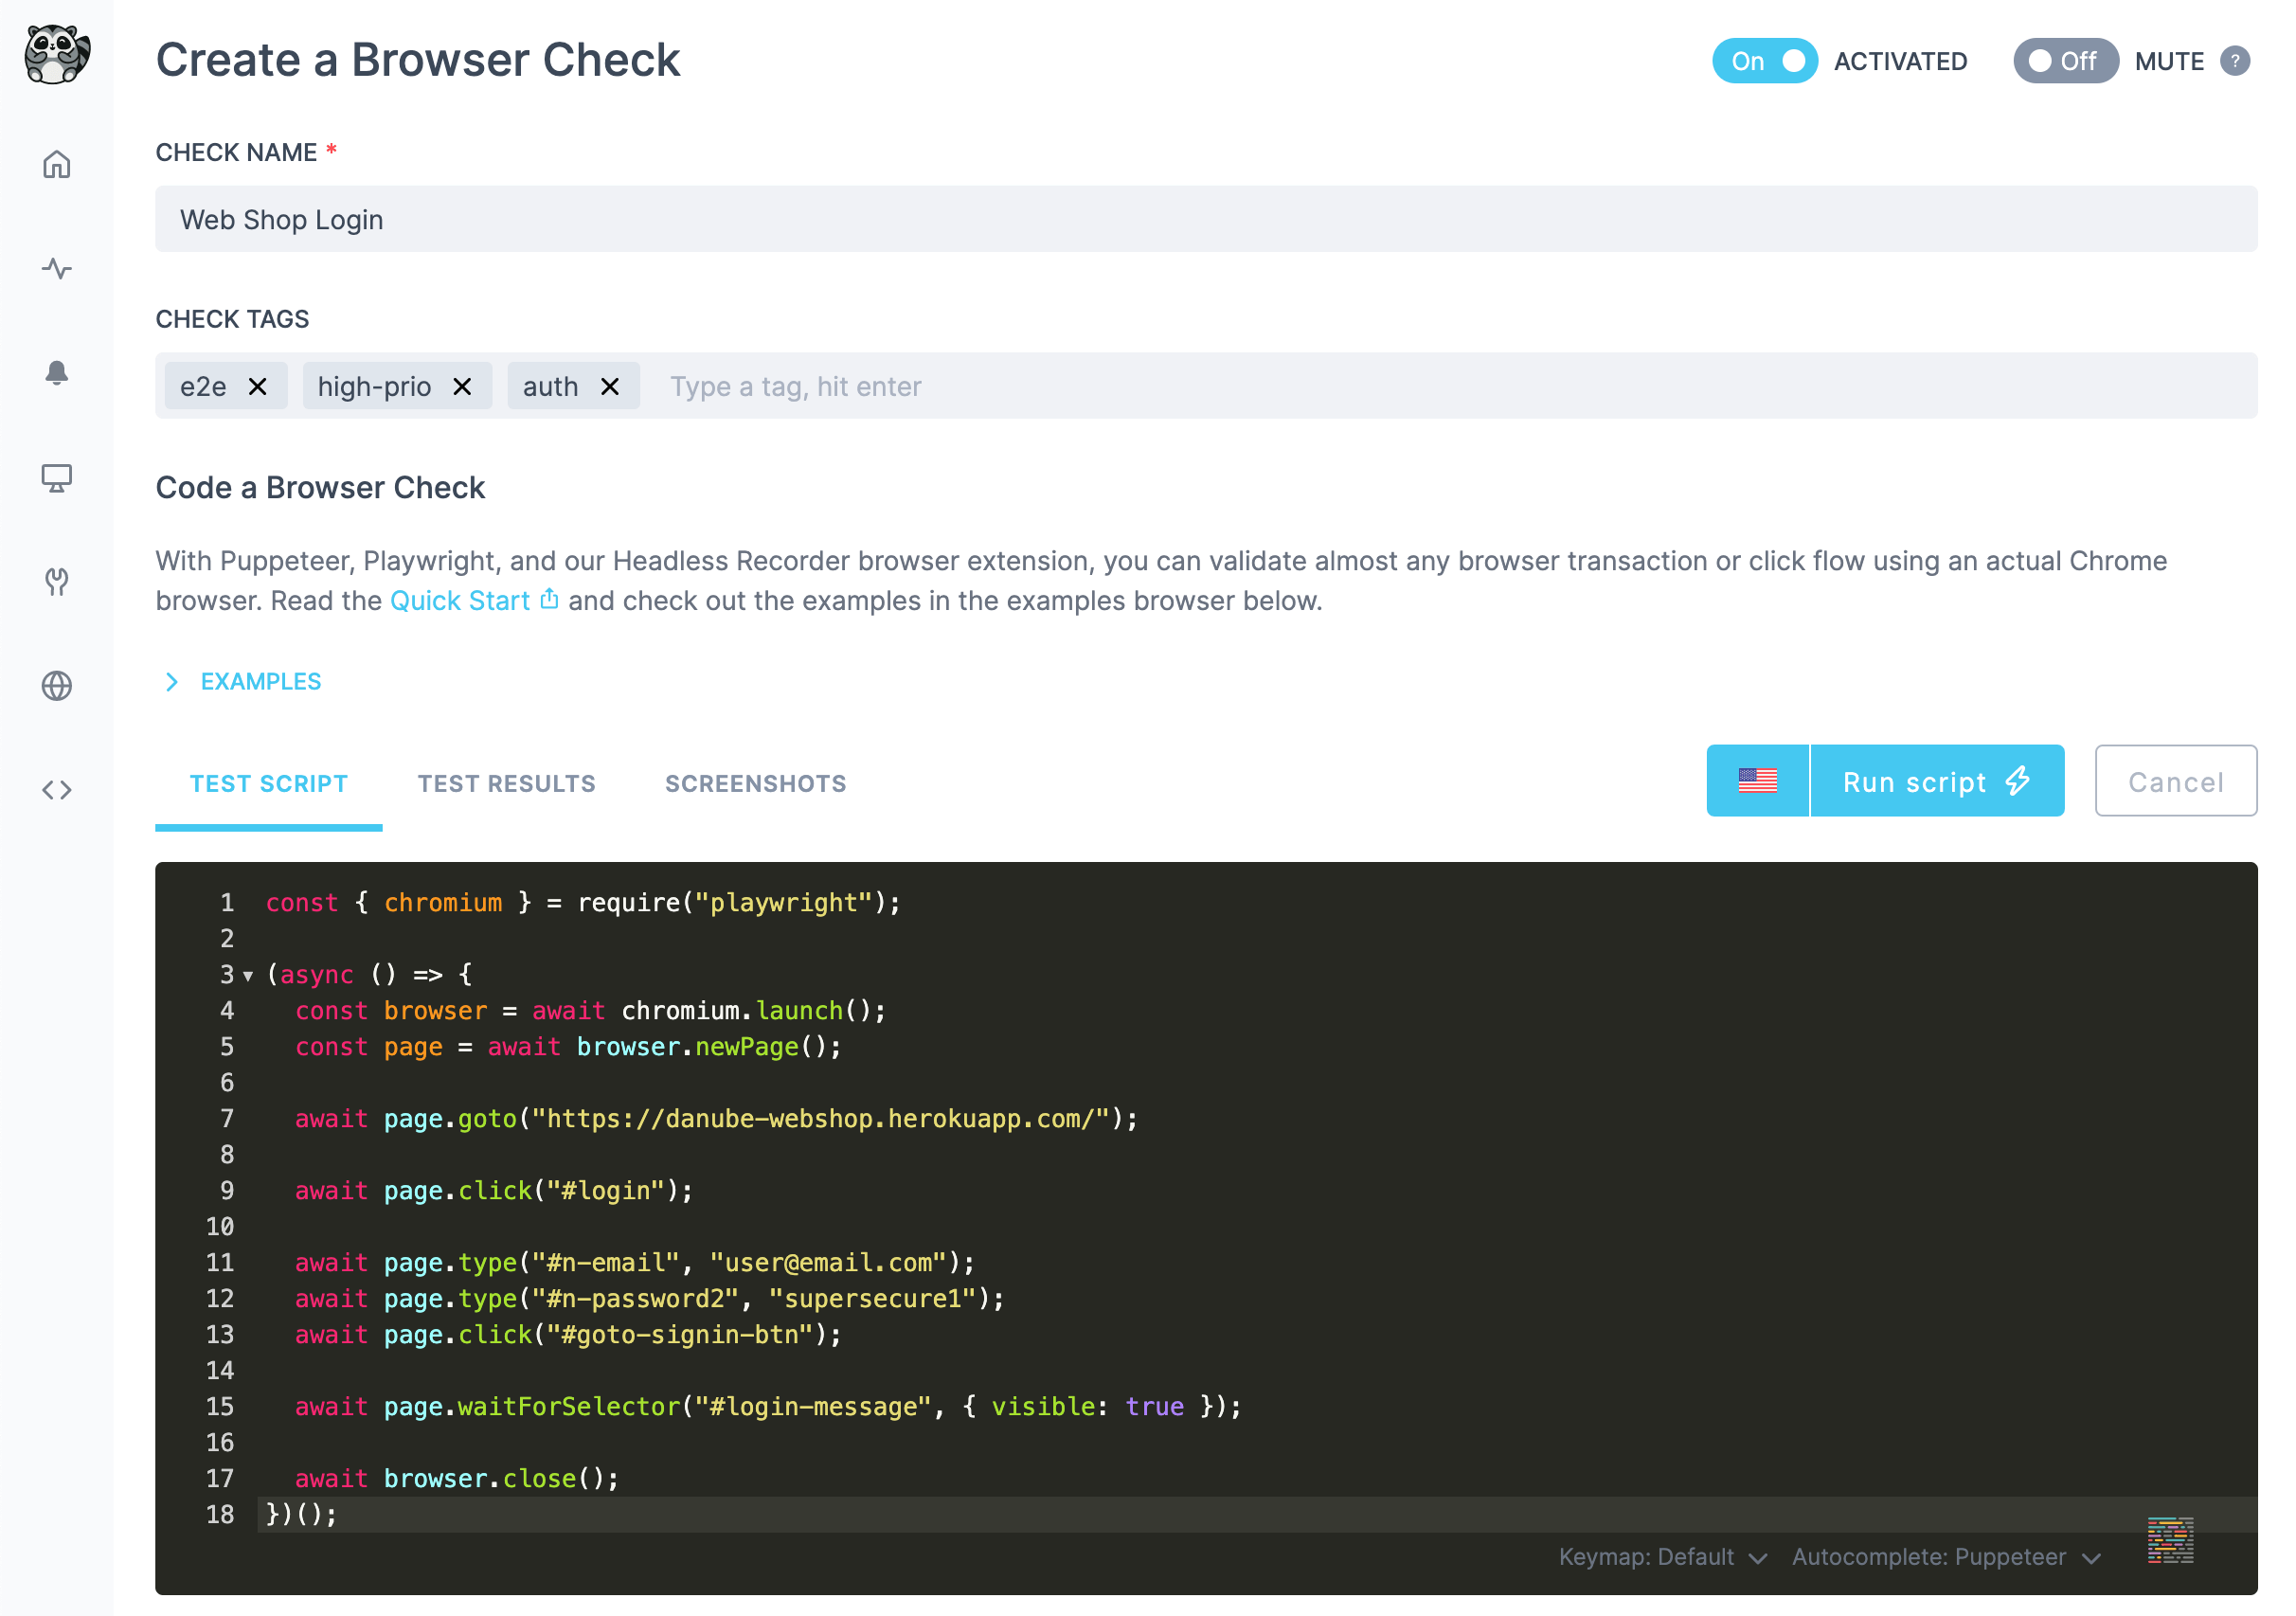
Check creation on Checkly
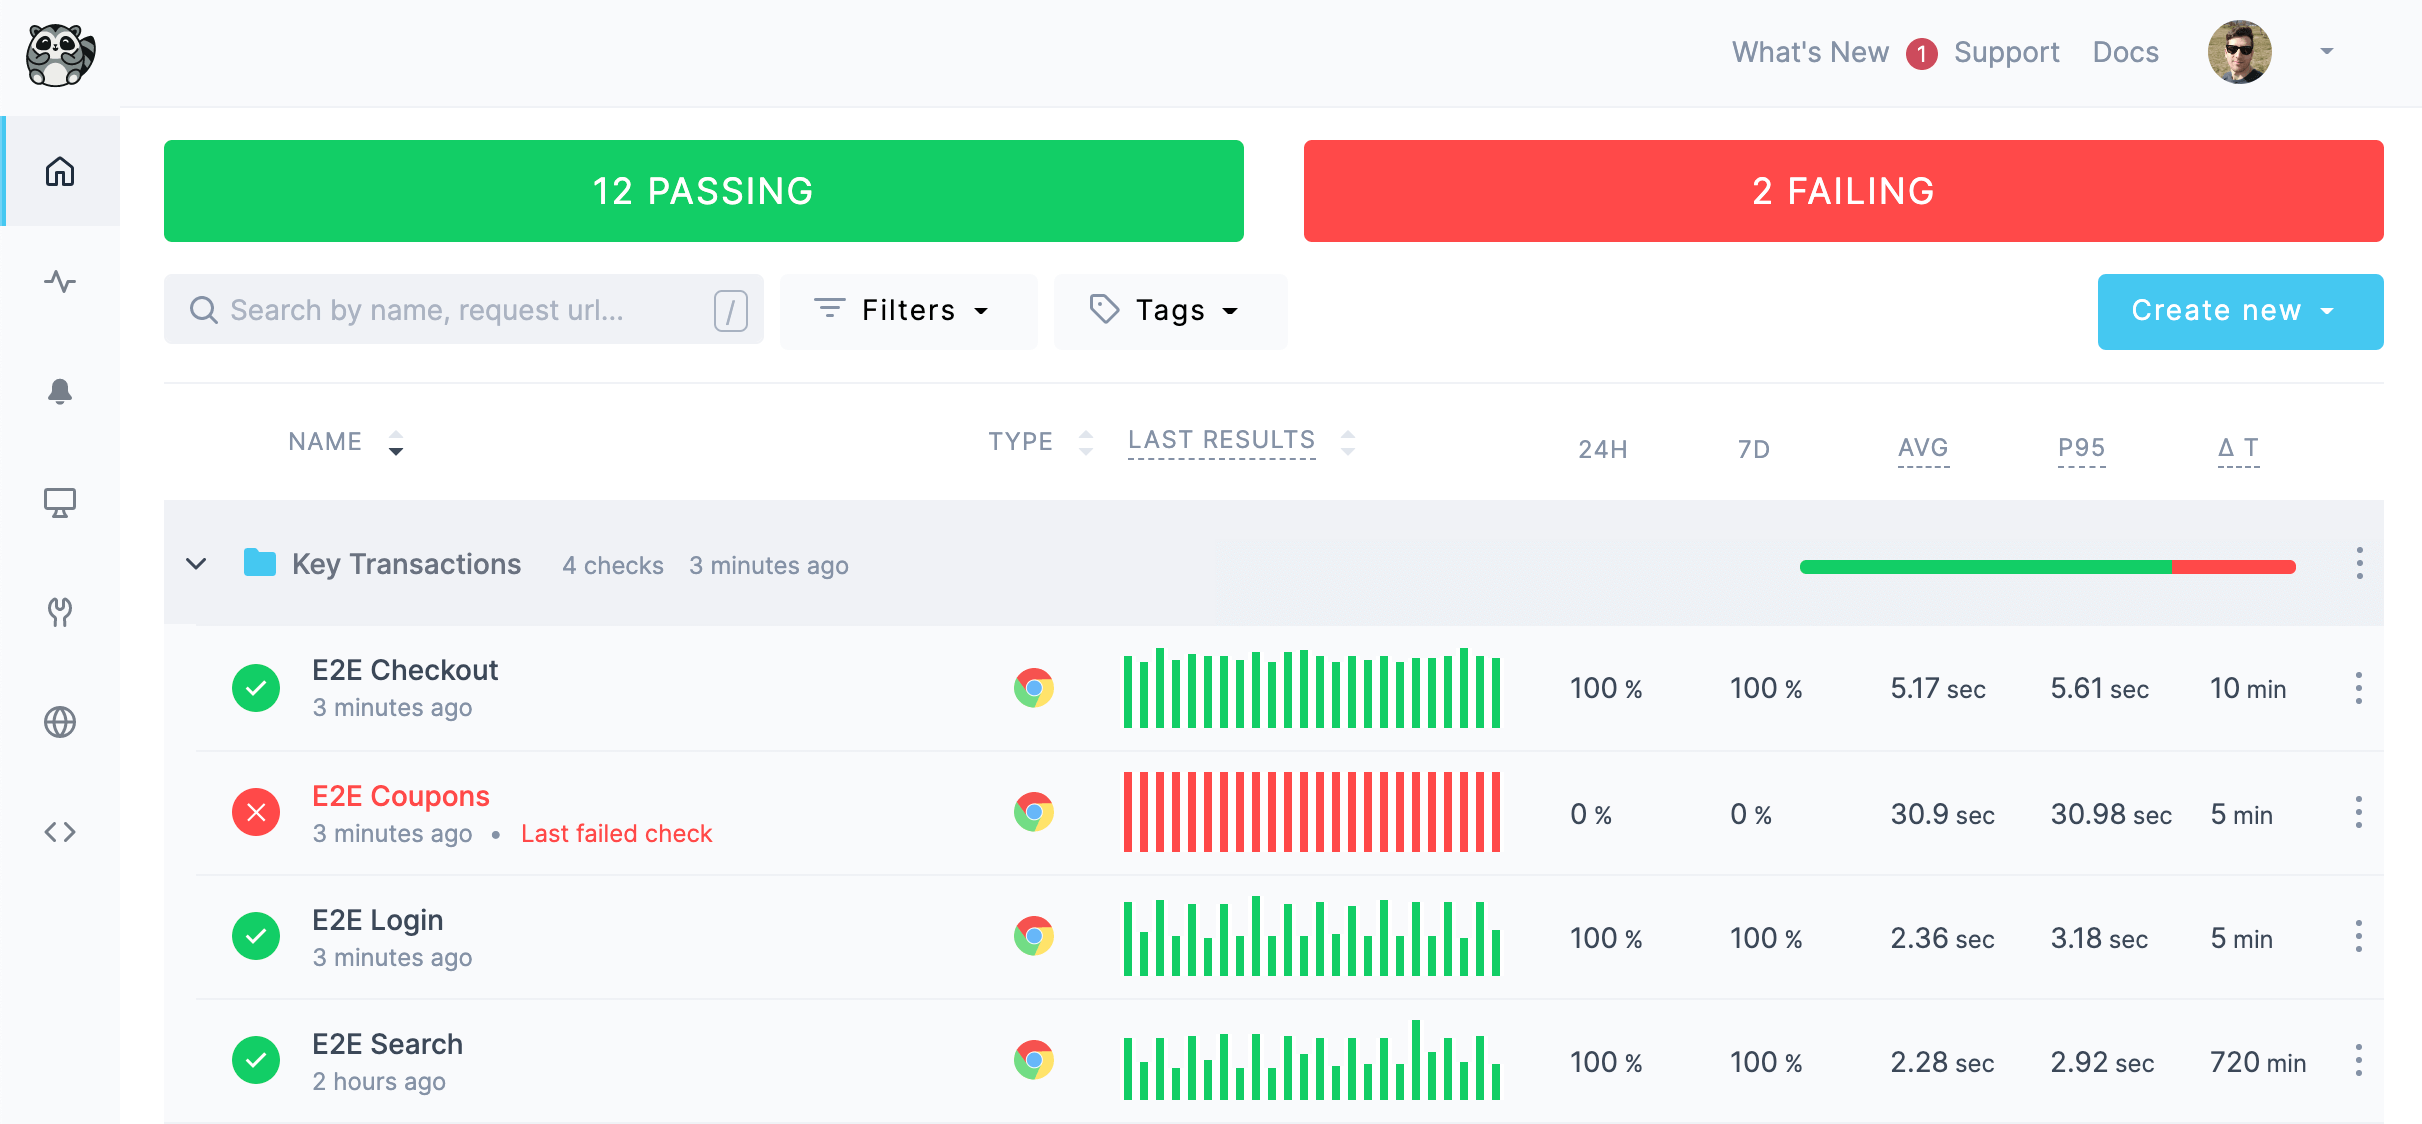
We can move our scripts to separate checks to keep them independent - we want to optimise for parallelisation and clarity of feedback.

Checkly's dashboard
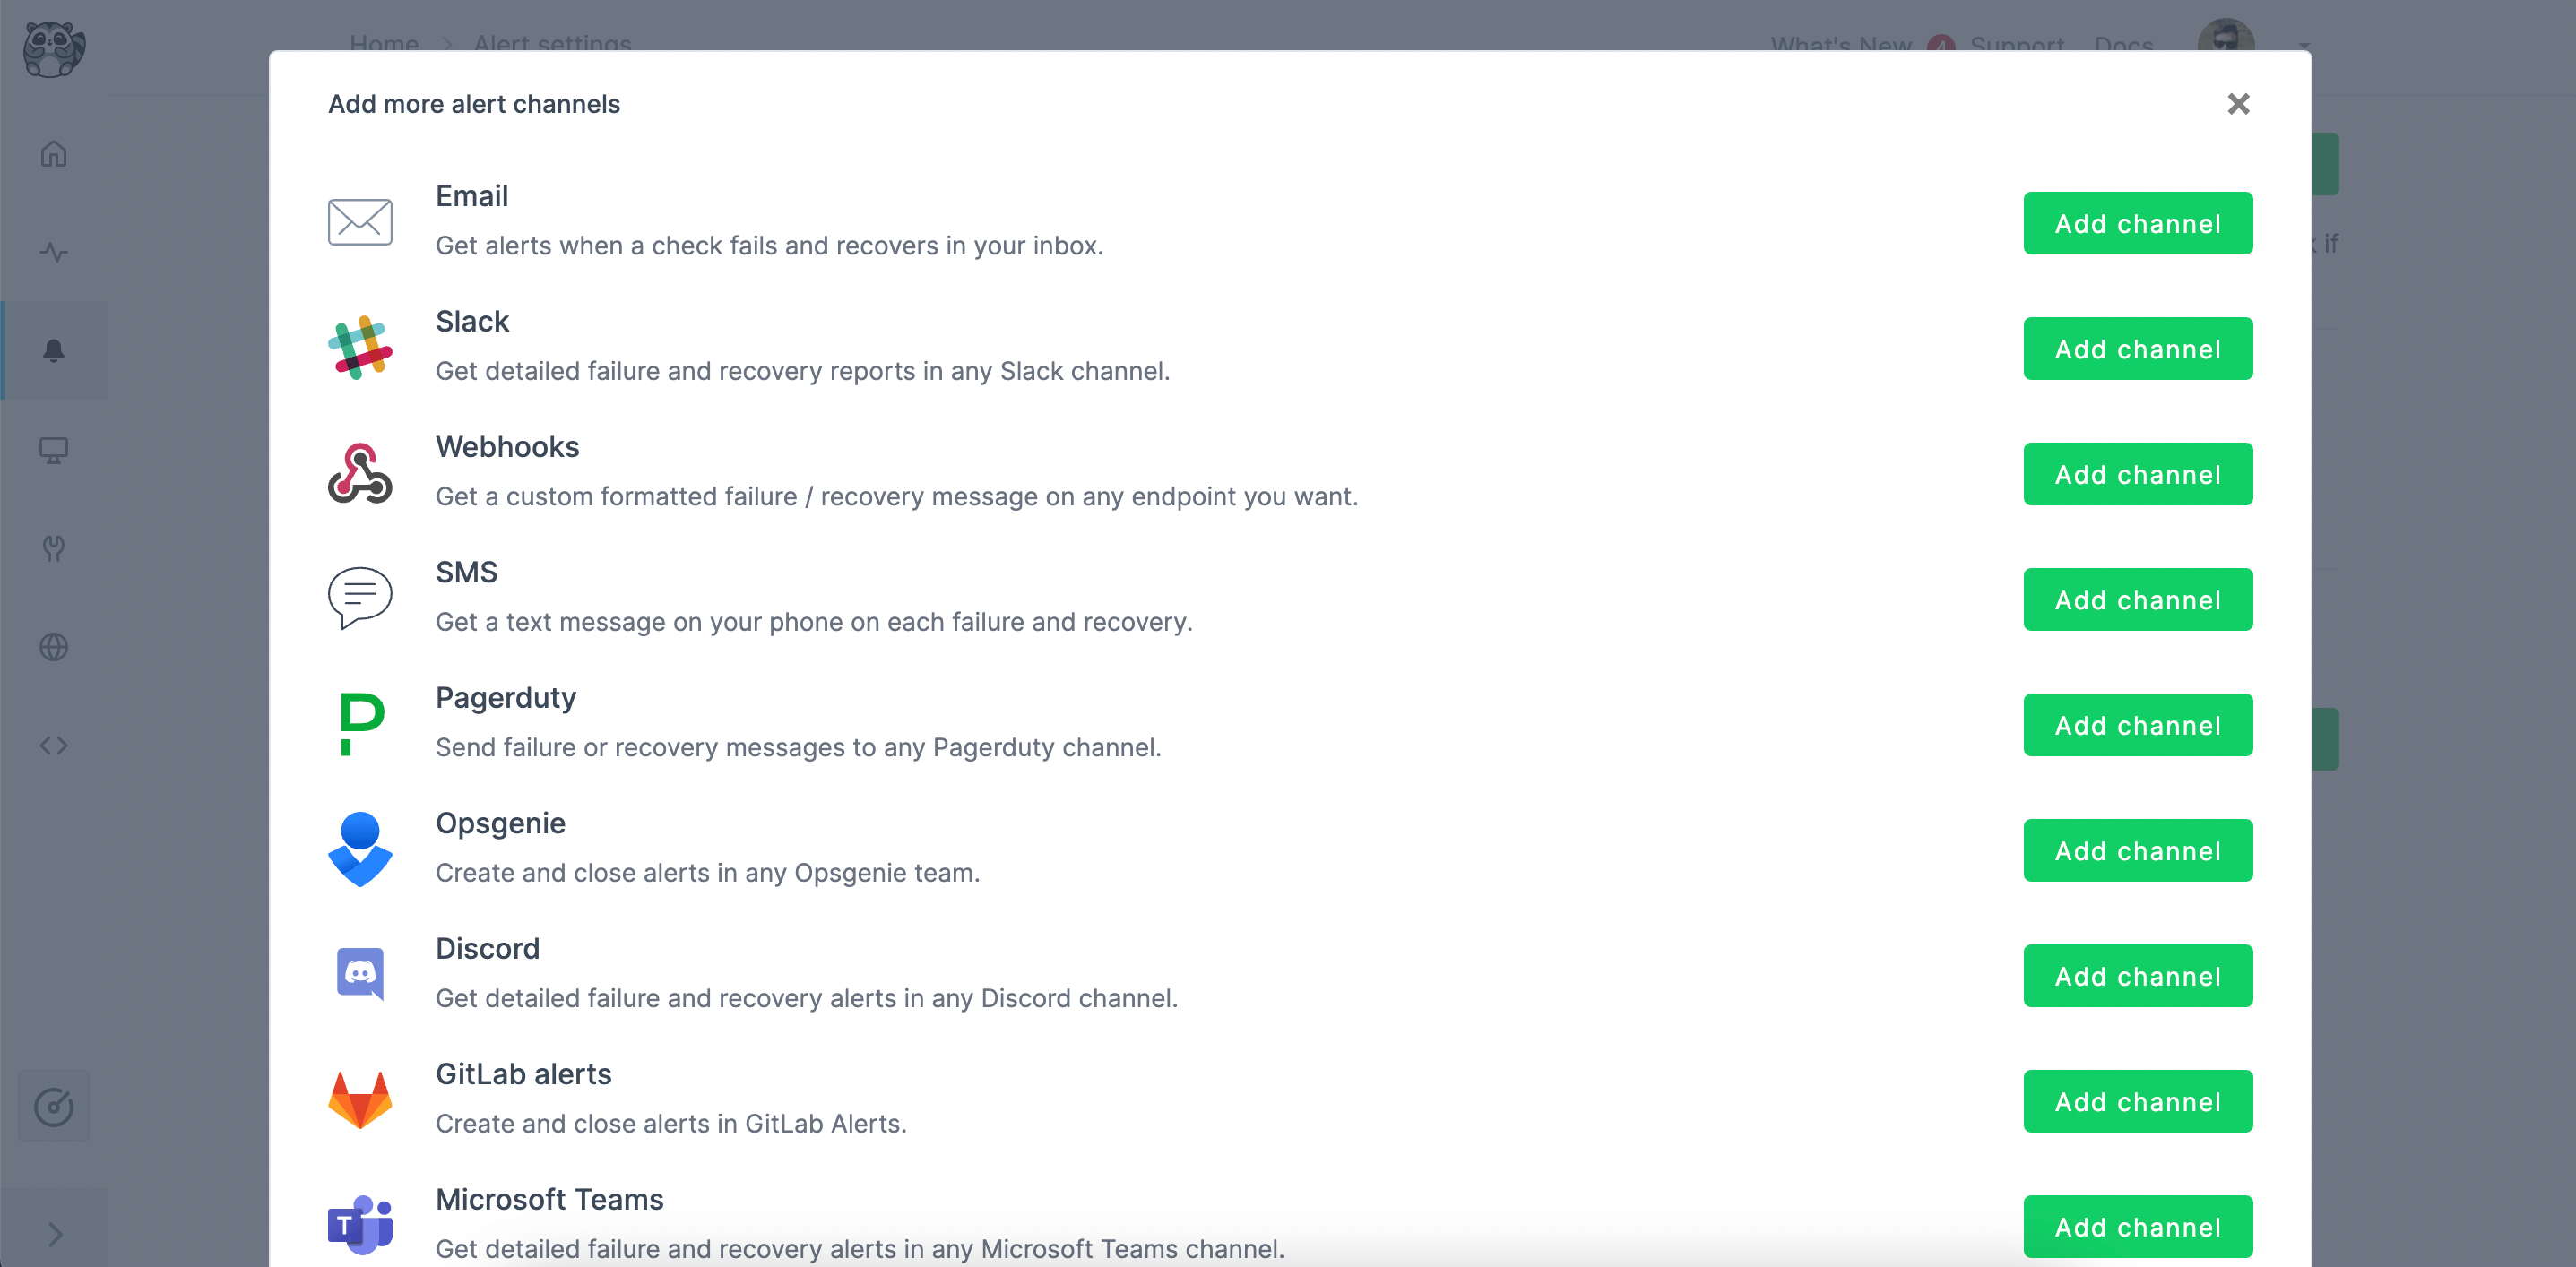
As soon as a check runs red, we are alerted in real time and can intervene before the issue impacts our users. Alerting can be set up with all the industry-standard channels like Pagerduty, Opsgenie, Slack, email, SMS and more.

Alert channels on Checkly
On-demand checking
Active monitoring and event-triggered testing do not exclude one another. You might want to have checks kicked off every time you deploy to production, or on every merge, PR or commit, or you might also want to run against your staging or development server. The choice has to be made based on your workflow and on your automation strategy.
CI/CD
Tests can be kicked off of CI pipelines. You might want to use different hooks (for e.g. smoke vs regression testing) in different stages and against different targets. Checkly supports all major CI servers.
Develop-preview-test
If you are using provider like Vercel, you can automatically trigger your checks to run on deployed PRs, too, to reap the benefits of the develop-preview-test approach.
Pitfalls
We learned things the hard way so you do not have to. When starting out, keep an eye out for the following pitfalls:
-
Non-independent tests: tests that rely on one another in any way (e.g. order of execution, test data) are hard to parallelise, resulting in longer execution times and potentially higher flakiness. Keep your tests independent.
-
Long, unfocused tests: checking too much in a single test will make failures harder to debug. Break it up instead, and enjoy the added parallelisation.
-
Messing up your own metrics, KPIs: remember, if you are not running against production, you want to make sure your E2E monitoring checks or tests are filtered out of your analytics. This is rather easy to do, with most headless browser tools normally identifying themselves as such from the start.
Read More
Start monitoring your API endpoints and your vital site transactions.
Start for free